Policy Shifts, Political Shocks & Market Signals.

Global Macro Pulse
Federal Reserve & Inflation Watch
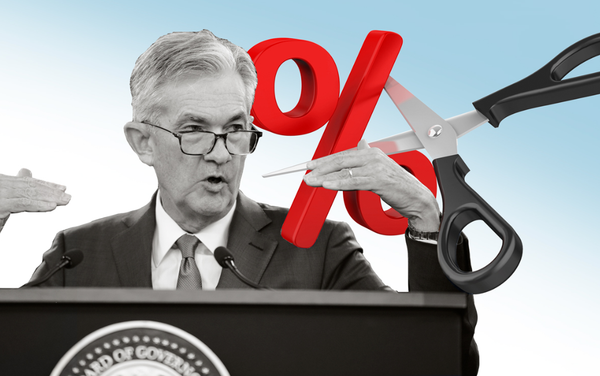
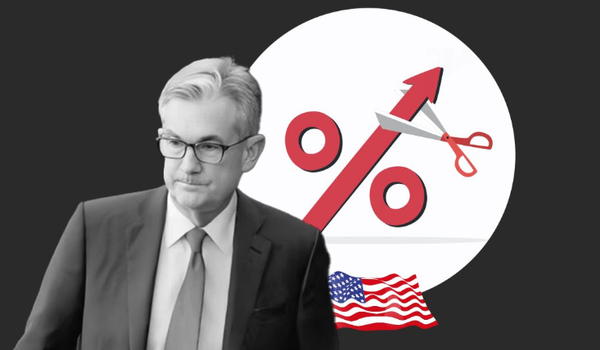
Market Stakes: A Fed Pivot on the Horizon
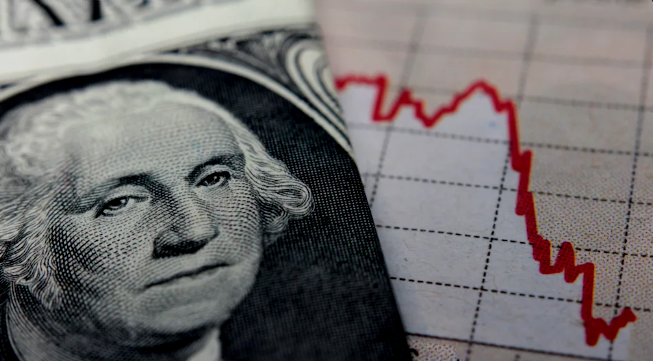
With just 22,000 jobs added in August—and downward revisions revealing a decline in June—U.S. job growth has all but stalled, while unemployment climbed to 4.3%, nearing a four-year high The Wall Street JournalReuters+1. This chilling data has marketplaces overwhelmingly pricing in a September rate cut, with the CME FedWatch tool showing ~100% odds in August SPC FinancialReuters. Similarly, markets are pondering the possibility of a bold move—a 50 basis‑point cut—though most forecasts lean toward a more traditional 25 basis‑point reduction Reuters.
Inflation’s Role: Quieting Crowns or Lingering Fears?
Despite cooling momentum, key inflation indicators remain stubbornly above the Fed’s 2% target. August “nowcasts” show:
- Headline CPI: ~2.86%
- Core CPI: ~3.02%
- Core PCE: ~2.92% Certuity
This backdrop tempers enthusiasm for aggressive cuts. As Fed watchers cautiously note, any sustained run of elevated service inflation could undermine dovish expectations.
Also under scrutiny: inflation data slated for September 11, which may be pivotal in shaping the Fed’s strategy Certuity.
Historical Echoes & Fed Credibility
Markets now seem to view bad economic news as good news—a sign pointing toward imminent easing. Yet, such expectations raise questions about central bank credibility. Will the Fed appear reactive—cowtowing to market pressure—or strategic and data-driven? Some comparison headlines:
- A half‑point cut, reminiscent of the opening salvo in September 2024’s easing cycle Reuters
- Alternatively, a conservative 25‑point trim in alignment with cautious Fed rhetoric.
Fed officials—including Chicago Fed President Austan Goolsbee—continue to underscore a data-dependent policy path, with eyes squarely on inflation MarketWatchReuters.
Geopolitics and Domestic Politics: Noise or Influence?
The labor report's weak tone has prompted political fallout—President Trump’s dismissal of BLS Commissioner Erika McEntarfer drew rebuke for undermining data integrity Wikipedia+1. Democrats have seized on the economic weakness to stoke political critique Politico. Meanwhile, military deployments have strained labor force dynamics, further muddling the job picture The Washington Post.
These developments heighten uncertainty, casting shadows over the Fed’s maneuverability and public confidence in its stewardship.
The Bottom Line: Waiting for the Pivot
Why Fed credibility matters: If inflation readings stay high, the Fed risks appearing disjointed or overly reactive to politics. Conversely, if labor and price data softens consistently, a plausible but measured 25‑point rate reduction seems the most likely path in mid-September.
What to watch next:
- Official August CPI release (Sept 11)
- Jobless claims & labor participation trends, especially amid military absences
- Any Fed commentary sharpening or shifting tone on policy responsiveness
Snapshot Table: Fed Metrics & Market Sentiment
| Metric | Current Status |
|---|---|
| Job growth | +22k in August, labor market softening |
| Unemployment rate | 4.3% (near 4-year high) |
| Market-implied cut odds | ~100% for September (some talk of 50 bp) |
| Inflation (CPI / Core CPI / PCE) | Elevated above 2% target |
| Key upcoming trigger | CPI data (Sept 11) |
Equity Markets Unpacked
Market Movers, Sector Spins & S&P Inclusions
Index Roundup: A Week of Mixed Signals
The U.S. stock market posted a mixed performance between September 1–7, 2025. The S&P 500 eked out a gain of 0.3%, the Nasdaq rallied 1.1%, while the Dow lagged, slipping 0.3%—clearly illustrating a tech-led small-cap momentum and a defensive tilt in larger industrials.Investors.comAP News
This split reflects ongoing investor sentiment: a dose of risk appetite expanding in tech and growth, tempered by caution at the megacap and industrial level.
Earnings Buzz & S&P Spotlight
There’s serious fireworks lighting up investor screens:
- AppLovin and Robinhood both surged roughly 7% in extended trading after being confirmed as new members of the S&P 500, joining Emcor Group, with changes effective September 22.Reuters+1Investors.comMarketWatchwsj.com
This inclusion isn’t just symbolic—it’s a tidal wave of passive fund demand, with ETFs needing to snap up shares to mirror the index. Still, the S&P committee also aims for sector balance, with AppLovin (Information Technology) and Robinhood (Financials) padding underrepresented industries.Reuters+1PR NewswireAInvest
Tesla also generated buzz—spiking 5.1% post-announcement of a potential $1 trillion compensation plan for Elon Musk and a new robotaxi app rollout. Meanwhile, Apple aged into the spotlight, entering a “buy zone” ahead of its iPhone 17 launch.Investors.com
Sector Rotation in Action
We’re seeing real capital reallocation: AI, semiconductors, fintech, and tech innovation are witnessing inflows, while traditional sectors like industrials and energy remain under pressure.
That rotation narrative, bolstered by the S&P inclusion news, points toward a bifurcated market—a “growth mid-cap boom” versus a cautious mega-cap landscape.
Trade Talk: What This Means for Investors
- Short-term play: Expect volatility spikes around the September 22 inclusion date.
- Technical setups: Look to chart patterns in names like Tesla and AppLovin for breakout signals—or exhaustion zones.
- Style lens: No surprise—growth and tech remain in demand. But wallet-savvy traders are watching for sentiment shifts post-inclusion.
Snapshot Table: Market Highlights
| Theme | Key Insight |
|---|---|
| Index Performance | S&P +0.3%, Nasdaq +1.1%, Dow –0.3% |
| S&P Inclusions | AppLovin, Robinhood, Emcor set to join on Sept 22 |
| Market Reaction | ~7% surge in AppLovin & Robinhood; ETF-driven buying expected |
| Sector Trends | Tech/growth outpacing industrials |
| Catalysts to Watch | Tesla robotaxi news, Apple iPhone 17 launch, S&P rebalance impact |
Forex Currents & Currency Strategy: Riding the Weakening Greenback
USD on the Defensive: Structural Drag Meets Fed Easing
The U.S. dollar continues its descent, pressured by widely anticipated Fed easing and lingering concerns about central bank independence. A recent Reuters survey found that 78% of strategists see ongoing dollar weakness, citing expectations of multiple rate cuts and political pressure on Fed policy.Reuters
Building on that, AInvest underscores how the dollar’s decline is not cover-the-headlineism—it’s a structural shift. Speculative funds now hold $4.7 billion in net short dollar positions, while central banks are diversifying into euros and gold.AInvest So if you’re still holding onto greenback-strength trades, reconsider the backdrop.
Cross-Currency Outlook: MUFG & J.P. Morgan Forecasts
- J.P. Morgan forecasts persistent dollar weakness: USD/JPY could ease to 141 by September, buzzing down to 139 by mid-2026; EUR/USD is expected to climb toward 1.20–1.22.JPMorgan
- MUFG sees USD/JPY headed lower—anticipating a slide to 143.50 amid U.S. rate cuts and potential BoJ tightening.Exchange Rates UK
Together, these insights frame a global FX outlook where the dollar loses altitude across the board.
Technical & Tactical: USD/JPY Nears Key Inflection
RoboForex flagged USD/JPY trading around 148.20, eyeing a correction toward 147.60, with ADP job data poised to be the next catalyst.RoboForex
Further, a stochastic oscillator turning down and USD/JPY’s failure to hold above 148.80 favor a short-term dip toward 147.80, with a rebound possible toward 149.85 thereafter.RoboForex+1
A break below 147.09 could extend the bear move toward 146.80, aligning with the lower Bollinger Band.TradingView
EUR/USD: A Bullish Range-Bound Setup
EUR/USD has found footing around 1.1670, buoyed by technical support around 50-EMA (1.1659) and 200-EMA (1.1656). A breakout toward 1.1735 is plausible, supported by rising Fed rate-cut expectations.Trading News+1
Conservative traders are eyeing entries above 1.165, albeit with some technical caution given narrow ranges earlier in the week.Insurance News | InsuranceNewsNetLiteFinance
Strategy Snapshot: Building FX Edge
| Currency Pair | Outlook & Strategy |
|---|---|
| USD/JPY | Target 147.5–147.8 short; rebound to 149–149.5 possible. MUFG’s longer target: 143.5. |
| EUR/USD | Look for push above 1.1670 to target 1.17–1.18 in near term. Alive to risk of resistance at 1.1735. |
| USD (General) | Structural bearish—hedge with non-USD assets and revisit cross setups amid Fed divergence. |
What Matters Next
- September 17 Fed decision & subsequent forward guidance—will the tone remain data-dependent or signal deep easing?
- Labor and inflation data—soft numbers reinforce dollar weakness; stickiness may prompt pullbacks.
- BoJ policy and global risk flows—a dovish U.S. central bank paired with hints of tightening in Japan could accelerate yen strength.
Commodities Corner – From Gold Glimmers to Oil Moves
Precious Metals: Gold’s Record Run & Silver’s Surge
Gold Glides Past $3,500—Can It Hit $5,000?
Gold soared to a fresh record high of $3,526 per ounce on September 2, propelled by Fed concerns, dollar weakness, and heightened geopolitical uncertainty Financial Times. Strategists from Macquarie, BNP Paribas, and ANZ point to reduced faith in traditional safe havens—namely the dollar and Treasuries—as a key driver Financial Times.
- Baseline outlook: Goldman Sachs projects gold to reach $4,000 by mid‑2026, supported by central bank accumulation and sustained ETF inflows ReutersFinancial Times.
- Tail‑risk scenario: If confidence in Fed independence erodes further, gold could skyrocket to nearly $5,000 per ounce—especially if just 1% of private U.S. Treasury holdings shift into gold The TimesFastBullAInvest.
Silver Jumps to 14-Year High—$40+ in Focus
Silver isn’t being left behind. As of early September, prices surpassed $40.8 per ounce, not seen since around 2011 Financial Times.
- Technical momentum is clear: FXStreet notes silver may test $41—if it clears $41.50, $42 becomes the next target Mitrade. However, RSI signals suggest it might be overbought, so a pullback toward $39.20–$39.77 is possible Mitrade.
- Structural fundamentals back the rally: Supply deficits and surging demand—especially from solar power, EVs, and AI—are tightening the market. Analysts forecast a push toward $40–$50 per ounce MoneyWeekReuters.
- In India, demand remains intense, with prices reaching ₹123,281/kg and expectations of growth toward ₹130k–₹135k/kg The Economic Times.
Oil & Energy: OPEC+ Reverses Course—and Sets Off Market Ripples
OPEC+ to Raise Output by 137k bpd in October
In a bold pivot, OPEC+ agreed to boost oil production starting October by 137,000 barrels per day—a sign that the cartel is prioritizing market share over price support Reuters+1The Wall Street JournalFinancial Times.
- This marks the beginning of an accelerated rollback of 1.65 million bpd in cuts, ahead of schedule ReutersFinancial Times.
- Despite the added supply, Brent crude remains stable near $65–$66, cushioned by Western sanctions and seasonal demand The Wall Street JournalFinancial TimesAInvest.
- OPEC+ will continue monitoring market conditions, with a revisit planned for the October 5 meeting ReutersFinancial TimesThe Wall Street Journal.
Commodities Snapshot
| Commodity | Key Developments & Forecasts |
|---|---|
| Gold | Record $3,526/oz. Baseline = $4,000 mid‑2026; tail‑risk up to $5,000 if Fed credibility falters. |
| Silver | At $40.8/oz. Technical upside to $42; long-term forecasts point to $50 if structural demand continues. |
| Oil | OPEC+ to add 137k bpd in Oct. Prices steady at $65–66. Potential glut looming in Q4. |
Why This Matters
- Safe-haven flight intensifies: With policy uncertainty and dollar erosion, investors are anchoring in gold—and increasingly silver.
- Industrial metal shorts lead to sharp rallies: Silver’s twin role—store of value and industrial input—is fueling the surge.
- Energy markets face a balancing act: Supply increases may cap oil upside, but demand drivers and geopolitical supply constraints still play a big role.
- Portfolio strategy tip: Mixed positioning with exposure to both precious metals and energy can offer balanced inflation protection and tactical upside.
Crypto & Digital Assets – Where BTC Meets the Altcoin Wave
Bitcoin vs. Ethereum: A Tale of Two Leaders
- Bitcoin trades around $107K, slightly softer after a recent market pullback. In contrast, Ethereum dropped over 7%, though analysts remain optimistic about its long-term fundamentals The Economic Times.
- The Altcoin Season Index (ASI) ticked up to 63 by early September, edging closer to the 75 trigger level that typically signals a full-blown alt season AInvest.
- Bitcoin dominance slipped to 59% as investors rotated into altcoins and Ethereum, highlighting a shift in capital allocation AInvestCoinLaw.
ETF Flow Dynamics: ETH Outpaces BTC
- August saw nearly $4 billion in Ethereum ETF inflows, dwarfing Bitcoin’s outflows of ~$966 million—a clear sign of institutional preference for ETH AInvest.
- August also marked a streak of positive ETF inflows for Ethereum, with a record $309.5 million in one day, dominated by BlackRock’s iShares Ethereum Trust AInvest.
- In contrast, Bitcoin ETFs experienced outflows, reinforcing Ethereum’s recent dominance in capital flows AInvest.
Altcoin Season: Is It Really Here?
- The ASI of 63 suggests momentum—but not confirmation—of alt season yet AInvest+1.
- Some voices are bullish: FBS analysts say we’re entering a capital rotation phase, led by institutional players deploying into Ethereum and select altcoins like Solana, Chainlink, and Hyperliquid etf.com.
- Bloomberg’s James Seyffart argues that while institutional crypto treasuries are thriving, individual altcoin ETF approvals may not spark a traditional altseason; institutional demand for diversification via baskets may be the real gamechanger CryptoSlateCoinpaper.
- Bitfinex analysts caution that until more altcoin ETFs launch, a broad-based rally across alts may remain elusive Cointelegraph.
Spotlight on Token Movements & Speculative Plays
- Ethereum is being hailed as "digital oil," powering DeFi, NFTs, and blockchain infrastructure—not just riding Bitcoin’s coattails The Economic Times.
- Institutions are piling in. Global X expects ETH to reach $7,500, while Tom Lee projects a possible $10,000–$12,000 by year-end The Australian. Another bullish estimate points to ETH hitting $7,000 by Q4 2025, driven by ETF adoption and institutional bets Indiatimes.
- Beyond ETH, altcoins are gaining attention. Little Pepe (LILPEPE), SUI, XLM, and ADA are touted as high-upside plays, offering 10x+ potential as meme, scalability, and privacy stories converge Indiatimes.
Strategy Snapshot
| Asset/Catalyst | Insight for Traders & Investors |
|---|---|
| Ethereum (ETH) | Strong structural plays via DeFi, staking; record ETF flows suggest institutional love; targets range from $6k to $12k |
| Altcoin Season (ASI ~63) | Approaching but not confirmed; monitor movement above 75 for validation |
| Token Picks | LILPEPE, SUI, XLM, ADA offer speculative upside in distinct verticals |
| Institutional Rotation | Targeting smart, infrastructure, and meme plays—focus on ETH-linked liquidity trail |
| ETF Landscape | Watch for new altcoin ETF approvals—likely to dictate broader market access and re-rating |
What to Watch Next
- Ethereum’s ETF flows—Will they sustain? A slowdown could spark short-term pullbacks.
- Altcoin Season Index & Bitcoin dominance—Breakouts above 75 or sub-55 could crystallize the rotation.
- SEC approvals for altcoin ETFs—Assets like ADA, SOL, and XRP are inching closer to institutional accessibility.
- Specific token catalysts—Governance upgrades, network launches, or real-world integrations may trigger big moves in smaller altcoins.
Strategic Insight & Market Psychology — The Push Pull Between Gold, Equities & Crypto
Gold vs. Equities: Safe-Haven Dynamics Unraveled
As markets brace for turbulence, gold’s rally reflects more than just price—it’s a psychological anchor. According to D.E. Shaw, gold’s appeal lies in its “non‑productive store of value” status. It isn’t tied to earnings or growth, offering a unique low-correlation buffer in portfolios—an ideal balancer when equities slide. Optimal allocations for risk mitigation, they argue, range between 6.5%–9% of liquid assets.MarketWatch
This narrative is reinforced by the current flight to safety. On September 2, stocks plunged—with the Dow down 441 points, S&P off 1.3%, and Nasdaq slipping 1.6%—while gold surged past $3,540/oz. That rush underscores investors’ pivot toward traditional hedges in the face of inflation, tariffs, and geopolitical threats.ReutersNew York Post
When Markets Crack and Gold Soars
Gold isn’t just a hedge—it’s a crisis refuge. During the worst market panics, it shows its worth. Recall Q1 2020: the S&P 500 fell 20%, while gold rallied 24%, climbing above $2,000/oz. In the stagflation of the 1970s, gold soared 2,300%, a testament to its shock protection.Discovery Alert
That said, safe-haven credentials aren't bulletproof. Some research shows that long-term correlations between gold and equities are inconsistent—meaning gold doesn’t always act as a reliable hedge over extended horizons.MDPI
Crypto vs. Gold: Two Sides of the Same Risk Paradox
2025 has seen both gold and bitcoin rising—but who’s the real crisis play? As of now, gold leads, up over 30% year-to-date versus Bitcoin’s ~25%. Critics point to gold's track record and central bank endorsements as edge-givers.MarketWatch
Yet, the crypto camp isn’t idle. Bitcoin ETFs now hold nearly $160B in AUM, narrowing in on gold ETFs at $180B—a sign of shifting investor preference, especially among younger, risk-seeking segments.MarketWatch
Intriguingly, HNW investors increasingly hold both assets—but for different reasons: gold for stability, crypto for growth and innovation.SSGA
The Psychology of Rotation
As macro pressures mount, capital shifts tell a story:
- Equities → Gold: Investors seeking shelter from volatility gravitate toward gold.
- Gold → Crypto: Meanwhile, speculative players chase tech-driven upside in digital assets.
Understanding this rotation helps pinpoint opportunities—and guard against herd-driven blindspots.
Strategy Snapshot
| Theme | Insight |
|---|---|
| Gold’s Role | A sentimental anchor during turmoil; low correlation with stocks makes it a strategic buffer. |
| Equity Drag Shockwaves | Steep selloffs amplify gold demand, reinforcing its safe-haven status. |
| Crypto Dynamics | High volatility but growing institutional traction; appeals to growth-hungry investors. |
| Behavioral Flows | Capital rebalancing between risk-off (gold) and risk-on (crypto) reflects shifting sentiment cycles. |
Quick Tips for Market Players
- Portfolio Defense: Consider a 6–9% gold allocation as a ballast in choppy waters.
- Rotation Tracking: Monitor AUM trends and positioning—not just price moves—to anticipate next shifts.
- Narrative Sensitivity: Be alert to headlines or policy shifts that could spark momentum swings—especially in cross-asset flows.
Horizon Scan — What’s Next on the Market Radar
Calendar Highlights & Market Catalysts
U.S. & Global Economic Watchpoints
- September 11 (Thursday): CPI and core CPI, flashing hot off the press. Barclays expects a ~0.34% uptick in core CPI, largely fueled by tariffs—a key figure as markets brace for the Fed’s upcoming decision.Kiplinger
- September 17 (Wednesday): The spotlight turns to the FOMC rate decision, followed by Powell’s commentary. This is the week’s driver of cross-asset moves—from bonds to FX to equities.Thomson Investment Group, Inc.Medium
- Sep 8–12: Other important stats include PPI, producer inventories, and the University of Michigan Consumer Sentiment Index—the latter potentially signaling whether households are still feeling optimistic or wary.Kiplinger
Global Central Banks & Regionals on the Move
- ECB rate decision is due around September 11, with markets expecting a hold—but traders will parse every word for forward guidance.Financial TimesS&P Global
- Locked in watch: BoE, BoJ decisions to follow, especially if they drop surprises ahead or after the U.S. Fed’s move.MediumS&P Global
Geopolitical & Policy Watch
- U.S. economic pressures persist ahead of a Supreme Court ruling on Trump’s tariff authority, with potential to reconfigure trade dynamics (and sentiment).The Times
- France’s Prime Minister fights off a confidence vote amid fiscal retrenchment, adding political fragility to eurozone risk.Financial Times
Corporate & Tech Trigger Alerts
- Apple’s iPhone 17 launch incoming—expected to inspire market chatter and bullish bets on tech platforms and supply chains.Investors.com
- Goldman Sachs Communacopia Conference underway—all eyes on speeches from tech giants and AI bellwethers; could shake sentiment and sector flows.Investors.com
- Watch for earnings from Oracle, Rubrik, Adobe, Chewy, and others—these releases will supplement macro cues with micro-level agility.Investors.com+1Kiplinger
Bond Markets & Investor Sentiment
- Bond yields dropped sharply as markets front-ran weak jobs numbers and ahead of rate decision week. Any surprises—hawkish or dovish—could spark fast moves.Barron's
Quick Drill: What to Watch & Trade
| Date | Event | Market Impact |
|---|---|---|
| Sep 11 | CPI & Core CPI Release | Fed path clarity; market repricing |
| Sep 17 | Fed Rate Decision + Press Conf. | Drive for equities, FX, bonds |
| Early–Mid Sept | PPI, Sentiment, ECB Rate — Global | EUR/USD, sentiment gauge, global tone |
| All Week | Apple Launch, Tech Conference, Earnings | Catalysts for sector rotation & buzz |
Strategy Pointers
- Markets Ahead of Fed: Stay nimble—CPI could swing the likelihood of a 50bp cut vs. 25bp stance, influencing trades across rates, equity, and FX.
- Tech & Sentiment Flow: Positive vibes from Apple or Goldman speeches could feed tech leadership and speculative flow.
- Risk Overlay: Political shocks in Europe or legal headlines on tariffs can trigger risk-off responses—watch USD, JPY, Treasuries.
- Bond Response Patterns: Treasury yields are a bellwether—if reaction to CPI or Fed is extreme, asset allocation strategies may need quick revision.