Brace for Lift-Off, Markets Go All-In on the Fed Pivot

What happens when stubborn inflation collides with political pressure and investor optimism? You get a market that’s aggressively pricing in rate cuts—despite signs the Fed may still be on the fence.
The second week of August was a whirlwind: Producer prices surged unexpectedly, retail sales remained solid, geopolitical tensions remained unresolved, and yet—U.S. equities charged to new highs. All while the probability of a September rate cut hovered around 92%, down slightly after last week’s peak near 99%.
This section explores the full macro picture: how inflation data, labor market shifts, Fed policy signals, political pressure, and global dynamics are shaping sentiment and asset flows.
Fed Cut Odds: Sky High, But Not Guaranteed
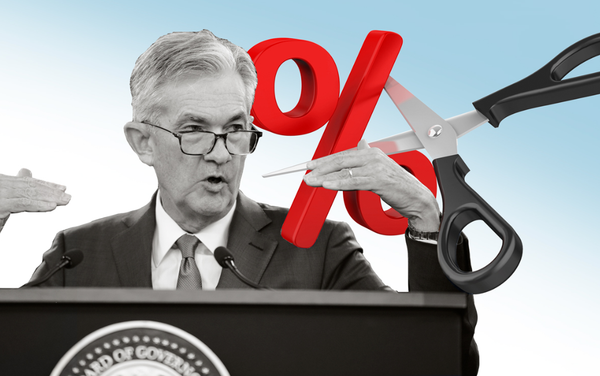
The market is nearly convinced the Federal Reserve will cut rates next month.
CME’s FedWatch Tool shows a 92.1% probability of a 25-basis-point cut at the September 17–18 FOMC meeting. That figure is down from 99.9% earlier this week, after the July Producer Price Index (PPI) shocked to the upside, rising 0.9% MoM and 3.3% YoY—the biggest monthly gain in more than two years.
Goods inflation came in hot at +1.2% MoM, led by energy and trade margins. Services inflation, which the Fed watches closely, rose 0.5%—its highest since late 2022.
This PPI print threw cold water on the idea that inflation is decisively cooling. While June CPI had come in soft at +2.7% YoY, the resurgence in producer prices suggests the Fed may wait for more evidence before pulling the trigger.
Powell's Jackson Hole Tightrope
All eyes now turn to Jackson Hole (August 22–24), where Fed Chair Jerome Powell is expected to outline the central bank’s evolving policy stance.
Here’s his challenge: Political pressure is mounting. Treasury Secretary Scott Bessent called for a “bold” 50 bps cut, citing slowing job growth and tariff-related headwinds.
Internal dissent is growing. Regional Fed presidents (e.g., Mary Daly and Raphael Bostic) have hinted at a split within the committee. Daly stated, “Policy is working, but we’re not ready to declare mission accomplished.”
Powell must balance these tensions with market expectations. His tone at Jackson Hole will likely determine the trajectory of yields, the dollar, and risk assets through year-end.
Key Quote:
“The die is cast,” said Jeremy Siegel (Wharton), “Markets sense it, and Powell knows it. A rate cut is coming—it’s only a matter of how much, and how fast.”
(Source: MarketWatch)
Economic Signals: Not So Clear
Labor data paints a picture of gradual weakening. July nonfarm payrolls came in at +144,000—below consensus. The unemployment rate held steady at 4.1%, but the labor force participation rate slipped to 62.2%. Average hourly earnings also slowed to 3.7% YoY.
Retail sales, however, remain robust. July’s figures showed a 0.4% MoM increase, with strength in home improvement, e-commerce, and discretionary categories. The U.S. consumer isn’t breaking—but inflation’s path is getting messy.
The Volatility Illusion
The CBOE Volatility Index (VIX) is hovering around 14–15, its lowest sustained range since Q4 2021.
Low volatility typically reflects investor confidence, but in this case, it may also signal complacency. With so many unknowns—Fed policy, tariffs, geopolitics—markets might be underestimating downside risks.
In 2019, the VIX traded below 15 for several weeks just before the U.S.–China trade war escalated. A similar surprise now (say, a second PPI beat or hawkish Powell speech) could cause a swift repricing.
Geopolitics: Behind the Headlines
President Trump’s surprise meeting with President Putin in Anchorage raised hopes of a potential thaw in U.S.–Russia relations. However, Ukraine tensions remain acute, and bipartisan criticism of the summit highlights the risks of overinterpreting the event.
The Biden administration is weighing new rounds of sanctions against Russian energy exports. Natural gas and oil markets are already showing signs of renewed volatility.
Safe-haven flows have increased to yen, Swiss franc, and gold, even as the dollar weakens overall.
China: Sluggish, Fragile, and Strategic
China’s economic data continues to disappoint. July retail sales rose just 3.7% YoY—the weakest since December 2024. Industrial output slowed to 5.7% YoY, and fixed asset investment grew only 1.6% YoY.
Asian equities fell sharply in response, though the MSCI China Index remains up 27% YTD—driven more by stimulus hopes than real momentum.
The yuan weakened to 7.42 against the dollar, raising concerns about capital flight and renewed trade friction.
Inflation, Tariffs & Policy Credibility
The “Liberation Day” tariffs announced in April 2025—targeting Swiss precision goods and Indian textiles—are beginning to ripple through inflation data.
Economists warn they could delay disinflation or reignite goods inflation, putting the Fed in a tough spot. In 2018, a similar dynamic forced the Fed to pause its easing cycle after one cut. 2025 may be replaying that script.
Safe-Haven Dynamics: FX, Gold, and Flows
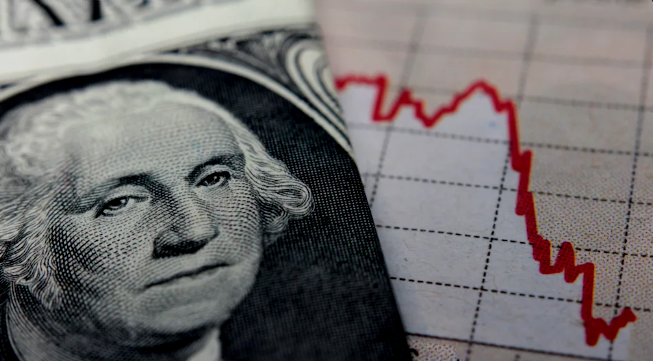
The dollar slipped this week, with the DXY falling roughly 0.7% on soft CPI and rising cut bets. However, it rebounded slightly after the hot PPI reading, showing traders are still data-sensitive.
The yen and Swiss franc have both appreciated modestly, classic signals of a risk-off sentiment. Meanwhile, gold topped $3,550/oz midweek before settling near $3,465/oz, driven by ETF inflows and hedge demand.
Macro Recap Table
| Indicator/Event | Latest Reading / Signal |
|---|---|
| Fed Cut Probability (Sep) | 92.1% for 25 bps; ~6% for 50 bps |
| July PPI | +0.9% MoM, +3.3% YoY—biggest jump since 2022 |
| July Retail Sales | +0.4% MoM—stronger-than-expected consumer spending |
| VIX Index | 14.5—complacent levels despite looming catalysts |
| China Retail Sales | +3.7%—lowest in 8 months |
| USD Index (DXY) | –0.7% this week; still volatile post-data |
| Yen (USD/JPY) | Strengthening toward 155.2 |
| Gold | Peaked at $3,550/oz before retracing |
What’s Next?
- August 22–24: Powell’s Jackson Hole speech—critical tone-setting moment.
- August 30: Eurozone PMI—first glimpse at European business health post-summer.
- September 5: U.S. Nonfarm Payrolls—likely the last data point before the September Fed meeting.
- September 18: FOMC Decision—the pivot point for Q4 strategy.
Bottom Line
Markets want the Fed to cut. Politicians are pressuring for faster action. The data? Mixed. The danger? Investors may be too far ahead of the Fed—and if Powell resists, risk assets could face a rude awakening.
Equity Markets: Stocks in Focus
Mega‑Cap Momentum Meets Strategic Rotation
Weekly Market Recap
Last week’s market activity delivered both resilience and rotation. The Dow Jones Industrial Average rose 1.7%, while the S&P 500 and Nasdaq notched gains of approximately 0.9% and 0.8%, respectively. Notably, the small-cap Russell 2000 surged ahead with a 3.1% jump—signaling broader participation beyond just mega-cap tech leaders. Investor's Business Daily
Friday’s session brought a mild reversal in tech momentum: the S&P 500 slipped 0.3%, Nasdaq edged down 0.4%, and the Russell 2000 fell 0.5%. Still, the Dow managed a slight rise. A standout mover was UnitedHealth Group, which jumped sharply after Berkshire Hathaway disclosed a multi-million share purchase. Meanwhile, shares of Applied Materials dipped amid concerns about its exposure to China. AP News
Drivers of the Rally
Retail and cyclical sectors offered a powerful boost. Retailers like Walmart and Home Depot lifted early-week sentiment, and the revival spread into healthcare and housing. Mega-cap growth, especially AI-linked names, faced rotational pressure, causing investors to diversify exposure toward defensive and cyclical playbooks. Wikipedia+6Investor's Business Daily+6Investopedia+6
The Tom Lee Take
Fundstrat’s Tom Lee dubbed the current rebound the “most hated V-shaped rally,” reflecting surging enthusiasm after widespread disregard earlier this year. He remains bullish, forecasting the S&P 500 could reach 6,600 by year-end—a bold call anchored in easing expectations and resilient earnings. Investor's Business Daily
Big Tech & AI—Pressures and Buy Points
AI mega-caps experienced a breather, while others moved upward. Tesla, Micron, and AppLovin each approached potential buy zones—Tesla around 348.98, Micron near 129.85, and AppLovin close to 428.99. These levels may offer technical entry points if broader momentum holds. Investor's Business Daily+2MarketWatch+2
Broader Context & Comparisons
This rally echoes the market’s post-“Liberation Day” flash crash rebound earlier in April, when sweeping tariff news spurred one of the fastest rebounds in recent memory. Stocks erased the carnage, with indices soaring back to, and beyond, prior highs. Wikipedia+3Wikipedia+3Wikipedia+3
Record levels continue to prevail. The S&P 500 closed at 6,468.54 on August 14 and even touched an intraday high of 6,481.34. Wikipedia
Equity Landscape Snapshot
| Theme | Insight |
|---|---|
| Broadening Momentum | Small-cap and cyclical sectors gaining traction, easing reliance on tech. |
| Healthcare Spike | UnitedHealth surged on Berkshire's stake—defensive strength. |
| Chip Stocks Diverge | Applied Materials slid, Intel advanced amid support speculation. |
| Technical Setups | Watch Tesla, Micron, AppLovin for breakout signals. |
| Risk Appetite | Mixed performance underscores cautious optimism amid macro shifts. |
Narrative Layers & Strategic Takeaways
- Earnings in Focus: Retailers like Home Depot and Walmart remain key barometers for consumer health. Strong results can further tilt sentiment toward cyclicals—even as inflation persists.
- Rotation Strategy: With AI valuations stretched, defensive sectors provide balance. Investors may benefit from diversifying into healthcare and value if tech falters.
- Scenario Watchpoints:
- Soft Landing Playbook: Positive earnings and dovish Fed tone could extend gains broadly.
- Hold Watch: Elevated valuations make markets vulnerable to policy shifts or disappointing earnings.
- Drawdown Sensitivity: Narrow leadership leaves markets fragile should sentiment turn.
Forex: Currency Currents – When Safe Havens Shift with the Tide
Investors traded their focus from equities to FX this week, reshaping the narrative with clear signals—fueled by inflation data, Fed expectations, and geopolitical ripples.
Dollar Softens as Fed Cut Bets Rise
The U.S. dollar weakened noticeably, pulling the DXY index down to around 98.02 and flirting with two-week lows, as markets ramped up bets on a Fed easing in September. Softer CPI data and looming political pressure on the Fed kept the greenback on the back foot even after brief rebounds.BlackBull Markets
On technical charts, DXY reversed off its 100-day moving average post-NFP data, suggesting room for further correction if recession fears deepen.Forex
Yen and Euro Gain Ground
- The Japanese yen clawed back strength amid speculation that the Bank of Japan may pivot from its ultra-loose policy stance in response to mounting inflation.Investing.com India+15Reuters+15Reuters+15
- EUR/USD stabilized above the 1.168 level as mixed U.S. retail data undercut dollar demand and reinforced bullish momentum for the euro.Investing.com India+4Reuters+4FXStreet+4
Emerging-Market Currencies Under Pressure
In Asia, caution reigned. The USD/INR pair rose slightly following a hot PPI print that dimmed expectations for aggressive Fed action. Overall, Asian FX stood subdued, balancing inflation-driven apprehension and a fragile recovery mood.Reuters+8Investing.com India+8Reuters+8
Bullion and Safe‑Haven Flows Take Stage
- Gold’s safe-haven appeal rose, as global uncertainty and dovish rate bets kept it near recent highs.FastBull+1
- Swiss franc continued its quiet rally, with Bank of America noting that the CHF is increasingly acting like gold—a hedge against U.S. debt and policy risk.BlackBull Markets
What’s Guiding FX Flows
1. Monetary Policy Divergence
- The gap between Fed rate-cut expectations and BOJ or ECB policies is steering safe-haven flows into JPY, CHF, and gold—trading at higher levels even amid broader dollar weakness.
2. Inflation Data as a Pivot Point
- PPI’s spike reduced odds of aggressive Fed easing, spurring defensive moves in FX. Still, the broader tilt toward looser U.S. policy is pressuring the dollar lower.icmarkets-vnj.com+2FXStreet+2
3. Risk Sentiment & Trade-War Waves
- Trade tensions and geopolitical risk are elevating volatility, bolstering traditional havens even as the dollar charts a slide.icmarkets-vnj.com+2Punch News+2
Summary Table: Currency & Safe-Haven Movements
| Currency / Asset | Movement & Drivers |
|---|---|
| USD (DXY) | Weakened to ~98.02 on rising Fed cut pricing |
| JPY (USD/JPY) | Strengthened amid dovish Fed vs. hawkish BOJ divergence |
| EUR (EUR/USD) | Stabilized above 1.168 amid mixed U.S. data |
| INR (USD/INR) | Under pressure amid global uncertainty & dampened flows |
| CHF (USD/CHF) | Holding strong; BofA sees it as a top safe-haven |
| Gold | Remains elevated on uncertainty and Fed dovishness |
Bottom Line
The FX market has transitioned into “safe-haven mode,” driven by surging U.S. rate-cut expectations and global uncertainty. The dollar’s slide is fueling strength in JPY, EUR, CHF, and gold, while emerging currencies navigate skittish conditions. As we edge toward Jackson Hole, FX will be particularly sensitive to policy signals and geopolitical developments.
Crypto’s Bull Run: Institutional Flames Ignite Digital Gold
Bitcoin surged past its previous all-time high, topping $124,000 midweek—a milestone fueled by mounting institutional interest, Trump-era regulatory tailwinds, and soaring ETF inflows The Times of India+8Reuters+8AInvest+8. The market was further energized by President Trump’s executive order, which cleared the path for crypto inclusion in retirement accounts, spurring significant fund inflows Financial Times+1.
Bitcoin has now climbed roughly 30–32% year-to-date, buoyed by both demand and a favorable macro-political environment Barron's. Analysts suggest that breaking above $125K could pave the way for a move toward $150K The Times of India+6Reuters+6Reuters+6.
Ethereum and Altcoins: The Great Catch-Up
Ethereum made strong gains too—rising to as high as $4,780–4,800, approaching its November 2021 high Reuters+1.
U.S. ETFs for Ethereum are seeing a record $40 billion in weekly volume—spurred by over $3 billion in net inflows across just two weeks. Analysts liken the surge to Bitcoin’s ETF boom, noting that ETF demand is now a key upside driver AInvest.
Institutional accumulation is heavy: Ethereum ETFs alone attracted $268 million last week—the largest inflow into any single digital asset ETF Trends.
Binance research reveals July’s crypto market cap soared 13%. Ethereum led altcoins with a 48% rally, while stablecoin transfer volume reached $2.1 trillion—exceeding Visa’s throughput. Tokenized stocks adopted a meteoric 220% surge by month-end, underscoring crypto’s increasing role in institutional strategies CoinDesk.
IPO Buzz and Regulation Signals
The IPO window in crypto has burst open. Bullish, backed by Peter Thiel, raised $1.1 billion during its NYSE debut. Circle also launched dramatically, skyrocketing from $31 to $153, securing a valuation above $35 billion Investopedia+3Reuters+3Financial Times+3.
This IPO boom coincides with the GENIUS Act passing through the Senate, offering a regulatory framework for stablecoins—adding legitimacy and confidence to crypto markets Reuters+1.
Meanwhile, emerging norms—such as a safe harbor proposal from a16z and the DeFi Education Fund—advocate for regulatory clarity for decentralized apps that operate without user custody, hinting at long-term structural support for DeFi Axios.
Structural Trends & Market Psychology
- The Strategic Bitcoin Reserve, established via executive order in early 2025, reinforces crypto’s growing role within U.S. fiscal policy. The U.S. now holds an estimated 200,000 BTC in its reserve stockpile Wikipedia+2Wikipedia+2.
- Pakistan’s initiative to convert surplus energy into PoS mining and AI infrastructure demonstrates how emerging markets are innovatively deploying crypto as an economic lever Wikipedia.
- This reflects a broader global shift—crypto evolving from speculative asset to national strategic tool.
On-Chain and Sentiment Metrics
Despite Bitcoin’s rise, Ethereum stands out in broader performance momentum. The ETH/BTC ratio is grinding higher, signaling that investors are rotating into ETH and broader altcoin play Zerocap.
Volatility trends add insight: BTC implied vol has compressed to ~32%, while options flows show heavy buying of $4K calls on ETH, revealing speculative optimism and positioning for further gains Zerocap+1.
However, caution is prudent. Bitcoin’s earlier 30% drawdown—from nearly $110K to $75K—is a reminder that corrections are part of the cycle. Some analysts anticipate a quick flush now, paving the way for a robust Q4 rally—a pattern mirrored in prior bull cycles Cointelegraph.
Summary Table: Crypto Market Dynamics
| Asset / Trend | Insight |
|---|---|
| Bitcoin (BTC) | Surged past $124K; institutional & policy drivers pushing higher |
| Ethereum (ETH) | Nearing $4.8K high; led altcoin rally; ETF inflows accelerating |
| ETF Momentum | $40B weekly trading; ETH ETFs breaking dormancy with massive net inflows |
| Altcoin & Token Surge | 13% market cap rise in July; tokenized stocks +220% MoM |
| IPOs & Regulation | Bullish & Circle IPOs, GENIUS Act support crypto infrastructure |
| Strategic Adoption | U.S. Bitcoin reserve; Pakistan’s digital asset strategy |
| On-Chain Sentiment | ETH outshines BTC; heavy derivatives flows; alt experiments climb |
Bottom Line
Crypto markets are bullish, riding a wave of structural legitimacy, deep ETF flows, and macroeconomic alignment. While Bitcoin leads the charge, Ethereum and altcoins are capturing growing share—and emerging regulatory frameworks are fortifying the sector’s legitimacy. That said, historic volatility remains, inviting vigilance ahead of a likely explosive Q4 stretch.
Strategic Insights & Market Psychology
Decoding the Bull — and Where the Mindset Meets the Market
Investors may be dancing with bullish fervor, but beneath the surface lies a complex interplay of psychology, narrative, and risk tolerance. Understanding how sentiment shapes actions—and vice versa—can transform a newsletter from mere data digest into a strategic advantage.
Behavioral Underpinnings: From Herding to Euphoria
Investor behavior rarely follows a straight line—it tends to move in waves of emotion. In the crypto and equity spaces, this manifests as:
- Herd behavior: Traders lean into trends, reinforcing momentum—a powerful force when institutional and retail flows align.
Academic studies confirm that "irrational investors heavily rely on market sentiment due to fundamental uncertainties, leading to speculative bubbles" JPMorgan Chase+12The Data Scientist+12Business Insider+12IJIPSSRN. - Sentiment-driven speculation: Research on volatile marketplaces (like crypto) highlights overreactions and fear-driven trades. Such behavioral biases stem from loss aversion and the emotional pull of narratives over fundamentals SAGE Journals.
- In 2025, crypto sentiment soared and crashed on cues—from policy shifts to Musk tweets—underscoring just how reactive these markets can be.
Sentiment Indicators: Reading the Market Mood
1. VIX and the “Fear Gauge”
The VIX index has dropped to its lowest 2025 levels—signaling elevated complacency as markets fully price in a Fed cut and optimism ballooning arXivWall Street Journal.
2. ETF Flows and Asset Rotation
Massive inflows into Bitcoin and Ethereum ETFs reflect herd-like accumulation, where collective belief often outweighs fiscal logic in fueling digital momentum.
3. Surveys & Strategist Sentiment
Goldman Sachs now gauges a >10% chance of a correction in the next quarter and >20% over 12 months, highlighting growing caution in the face of optimism Business Insider. Similarly, HSBC flags five key risks—from yield-driven drawdowns to policy interference—that could puncture the bull run Reuters+15Business Insider+15Business Insider+15.
Emotional Drivers – The Bigger Picture
The forces behind this rally are more than just numbers:
| Driver | Market Impact |
|---|---|
| AI/Tech FOMO | Accelerated gains as investors chase narrative and promise, not just earnings. |
| Monetary Optimism | Fed cut bets legitimize buying in cyclicals and high-growth sectors. |
| Scary Soft Landing Narrative | Bull cycle fueled by hope of growth without inflation surge. |
| Regulatory Tailwinds | Crypto’s renewed legitimacy (GENIUS Act, IPOs) amplifies speculative confidence. |
| Fatigue & FOMO (Crypto) | Crypto’s mood swings tracked via Fear & Greed indicators plunge, only to vault in recovery SAGE Journals+14AInvest+14Reuters+14The Data Scientist. |
Strategic Playbook: Riding the Wave, Building Resilience
- Participate—but hedge
- Lean into high-conviction rallies (tech, crypto) with options or protective strategies.
- Use inverse ETFs or volatility contracts to guard against sharp reversals.
- Blend momentum with caution
- Stay long but stagger exposure—rotate capital into defensives (healthcare, value names) when valuations stretch.
- Play the narrative—wisely
- Monitor sentiment signals (VIX, AAII, crypto indexes) as early warning systems for shifts.
- Watch the Kik-backs
- After sharp advances, profit-taking and consolidation often follow. Plan exits/triggers—don’t gamble on endless froth.
A Psychological Edge
In 2025, investing is as much about mindset as it is about models. Markets are embracing hope (Fed cuts, AI transformation, crypto legitimacy), but psychology’s role is pivotal: fear can tip into euphoria as quickly as euphoria can flip to skepticism.
Savvy investors don’t follow blindly—they sense the crowd, brace the fall, and fine-tune their exposure.
Horizon Scan: What’s Next
As markets cool their heels post-rally, all eyes are on what’s coming next. Here’s your comprehensive roadmap to the key events, policy signals, and geopolitical flashpoints likely to shape Q3 and beyond.
Jackson Hole & Fed’s Next Move
The Jackson Hole Economic Policy Symposium (Aug 22–24) is shaping up to be one of the most critical Fed-themed gatherings of the year. Markets hope Jerome Powell delivers a clear pivot message—especially after internal dissent and pressure from the White House. His tone could either validate optimism—or sharply undermine it.
Reuters+5Financial Times+5World Economic Forum+5Investopedia+2Financial Times+2
Investors will also parse July FOMC minutes, set for release midweek. These minutes are expected to offer insight into the Fed's internal divisions, with two members pushing for immediate cuts.
Investopedia+1
Retail Earnings & the Consumer Pulse
Retail giants step into the spotlight with earnings from Walmart, Home Depot, Target, Lowe’s, and Ross. Investors will be tuning in to whether they're passing tariffs onto prices—or absorbing costs, signaling pressure on margins and consumer confidence.
Investopedia+1
This earnings wave may provide the clearest consumer health read so far—critical for consumption-heavy sectors and inflation models.
Housing Data & High-Frequency Indicators
Housing activity is expected to remain weak, with housing starts and existing sales figures likely hovering near multi-year lows—reflecting affordability crunches and mortgage-rate fatigue.
tradealgo.com
These figures are vital—housing has become increasingly sensitive to rate talk and consumer sentiment.
Global Spotlights: Inflation, Elections & Peace Talks
A flurry of global inflation data (U.S., U.K., Canada) and central bank commentary—especially from ECB's Lagarde—will influence FX flows and global rate differentiation.
Commonwealth Financial Network+3tradealgo.com+3Investopedia+3Financial Times+1
On the geopolitical front, a Trump–Putin summit in Alaska may offer diplomatic surprises—potentially buoying European markets and safe-haven FX (EUR, bonds).
Reuters
Meanwhile, Bolivia’s elections signal a potential shift in Latin American sentiment—where market-friendly outcomes could inspire regional re-risking.
Reuters
Global Economic Calendar: Key Hotspots
From FXStreet’s global calendar, the coming weeks will be high-velocity:
- Japan’s CPI release may inform the Bank of Japan’s gradual normalization stance.
- Across Asia (Japan, India, Australia, South Korea), manufacturing PMI and trade data will highlight tariff and supply-chain sensitivities.
- In Switzerland and Europe, trade figures and wage data will test how inflation dynamics are evolving.
- RBNZ’s potential rate move and Canadian inflation readings may alter Antipodean FX and bond trajectories.
FXStreettradealgo.com+1
Timeline of Key Catalyst Events
| Date / Period | Event / Focus Area |
|---|---|
| Aug 20–21 | Release of July FOMC Minutes—insider Fed insight forecast |
| Aug 22–24 | Jackson Hole Symposium—Fed’s pivot narrative test |
| Late Aug | Retail earnings (Walmart, Home Depot, Target, etc.) |
| Late Aug | Housing Starts & Sales—macrosensitive consumption read** |
| Ongoing | Global CPI & policy speeches—inflation and rate divergence |
| This Week | Alaska Summit and Bolivia elections—geo tail risks |
| Mid–Late Aug | Asian & Eurozone PMI and CPI data across FX and trade |
Strategic Rundown
- Powell’s positioning at Jackson Hole could be the fulcrum for Q4 risk appetite—euphoria if dovish, caution if hawkish.
- Retail earnings will calibrate risk sentiment—strong results could reinforce cyclical rotation; weak ones may revive defensiveness.
- Housing stats will confirm if consumers remain tapped—or tapped out.
- Global CPI & inflation signals will adapt central bank mapping—especially in Europe and Asia.
- Geopolitical developments may pose tail risks—or tailwinds for risk-on sentiment.
Supplemental Data & Visual Cues
Thematic investing comes to life when powerful stories are paired with visual context—and this week’s narrative shines brightest through high-impact graphics and strategic data.
1. ETF Flow Dynamics: Where the Money’s Going
July ETF data confirms the tone of the year so far: the ETF universe is booming.
- $121 billion in inflows steered the total to $677 billion for 2025, keeping it on track for a record $1.3 trillion. U.S. equity ETFs accounted for $53 billion of July’s inflows, followed by bond ETFs ($30B), alternative assets ($6.9B), and commodities ($6.6B) SSGA+1.
- Global flows reveal a great rotation: While U.S.-focused equity funds saw $6.3B in outflows, EM and international equities amassed $13.6B through July—underscoring shifting sentiment toward global diversification Reuters.
- In August, flows reflected both caution and conviction: defensive plays dominated (U.S. Treasuries and gold ETFs attracted solid inflows), while the Indo-Pacific region surged with $40B entering equity ETFs—narratives around regional resilience and tariff hedging are clear MarketWatch+5AInvest+5The Australian+5.
2. Crypto ETF Inflows: Institutional on the Move
Crypto asset flows are breaking records:
- From April to mid-July, $17.8 billion flooded U.S. spot Bitcoin ETFs, marking a sharp institutional return after earlier outflows The Digital Chamber.
- In early August alone, Ethereum ETFs recorded over $3 billion in inflows—surpassing Bitcoin ETFs for the week AInvest+8tradingnews.com+8finance.yahoo.com+8.
These figures are a backdrop to an asset class pivoting decisively toward institutional infrastructure and legitimacy.
3. Structural Charts: Visual Themes at a Glance
Here’s how to translate the narrative into images that resonate:
- ETF Flow Bar Chart: Show month-over-month inflows across categories—equity, bond, geo, crypto. A side-by-side comparison helps readers visualize rotation trends.
- Geographic Equity Flow Map: Use global ETF inflow data to highlight surging investor interest in emerging and ex-U.S. markets—visually reinforcing the diversification trend.
- Crypto ETF Inflow Line Graph: Plot net flows for BTC and ETH over the past months to visualize momentum shifts.
- Risk-On / Risk-Off Watchlist: Pull ETF tickers (e.g., XLK, IWM, GLDM) into a small watchlist table or graphic—highlighting flows as sentiment signals.
4. Thematic Investment Callouts
Thematic investing remains central to 2025’s investment conversation. Sectors like AI, infrastructure, and sustainability continue to attract strategic capital according to industry data—but flows haven't been uniform. Highlight how ETF inflows are mirroring thematic interest (e.g., infrastructure ETFs gaining traction post–Jobs Act momentum) cfraresearch.com.
Consider including a visual sidebar:
- “Top Thematic ETFs: 2025 Snapshot” with icons or small graphs showing segments like AI, Infrastructure (PAVE), and thematic momentum.
5. Why These Visuals Matter
- Comprehension: Readers absorb 60% of visuals more readily than text alone. Visuals transform data into intuitive insight.
- Narrative Reinforcement: ETF flows flesh out the macro story—showing where conviction is (or isn't)—and tying all newsletter threads together.
- Actionable Intelligence: Charts like crypto inflows or equity rotation sequences enable readers to apply data as decision triggers.
Summary Table: Recommended Visual Assets
| Visual Asset | Purpose & Insight |
|---|---|
| ETF Flow Bar Chart | Visualize monthly investor preferences |
| Global Equity Flow Map | Highlight international capital shifts |
| Crypto ETF Inflow Trend Lines | Track institutional crypto behavior |
| Risk-On / Risk-Off Watchlist | Quick snapshot of sentiment via ETF flows |
| Thematic ETF Snapshot | Show sector-level investor conviction |